This article covers how to see your Profit and Loss
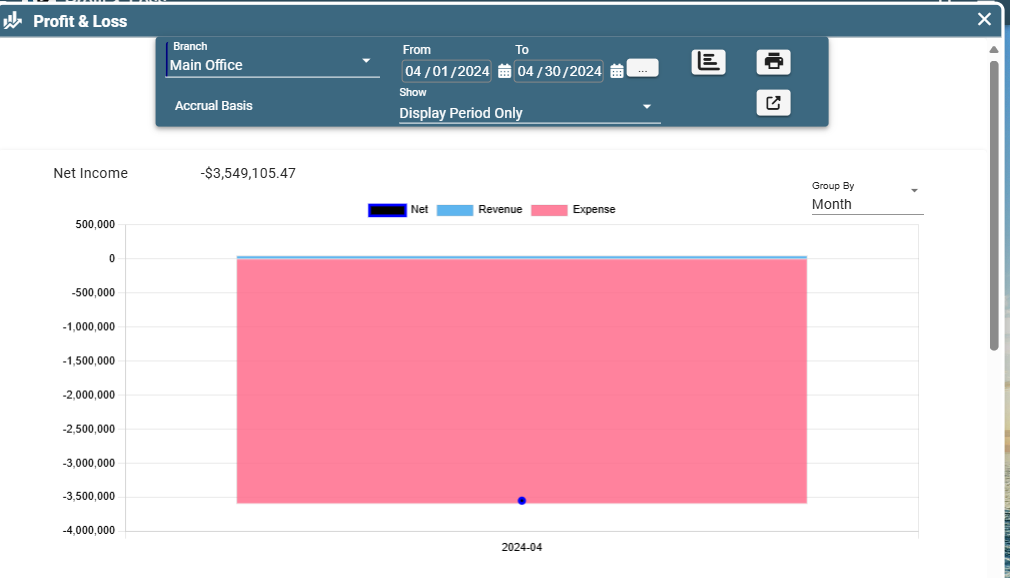
Apply the filters at the top to gather the necessary information for generating a profit and loss report.
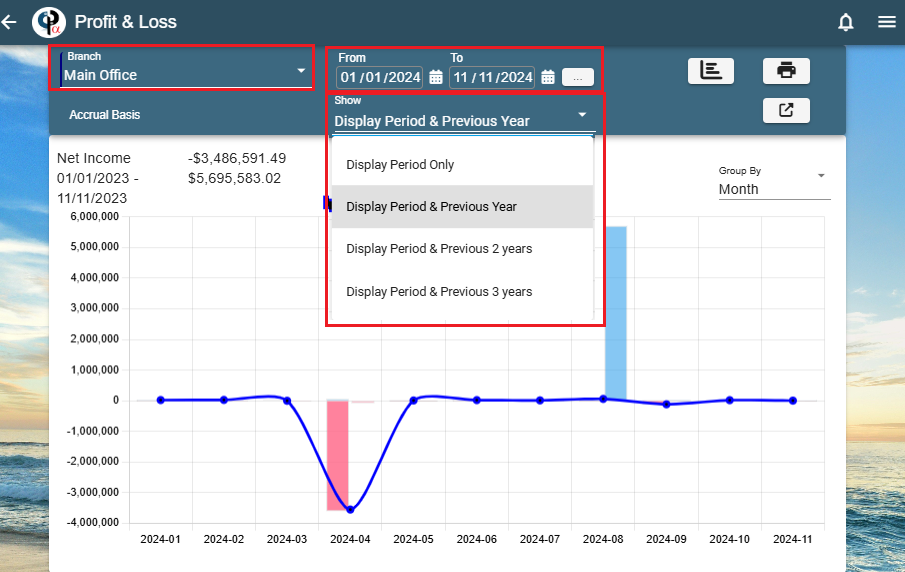
Select a branch, date range, and a time period to display
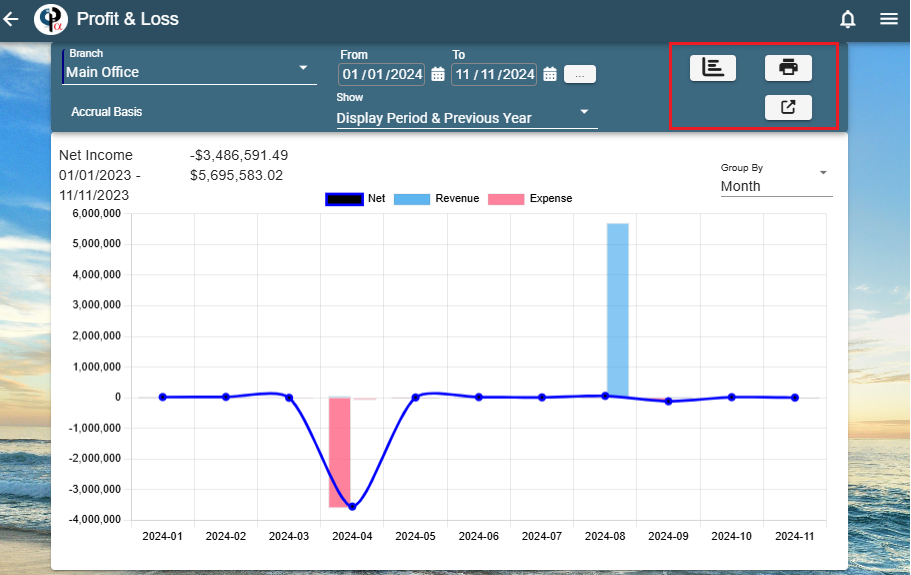
Use the buttons to hide the graph, print or export (this will create an excel file)
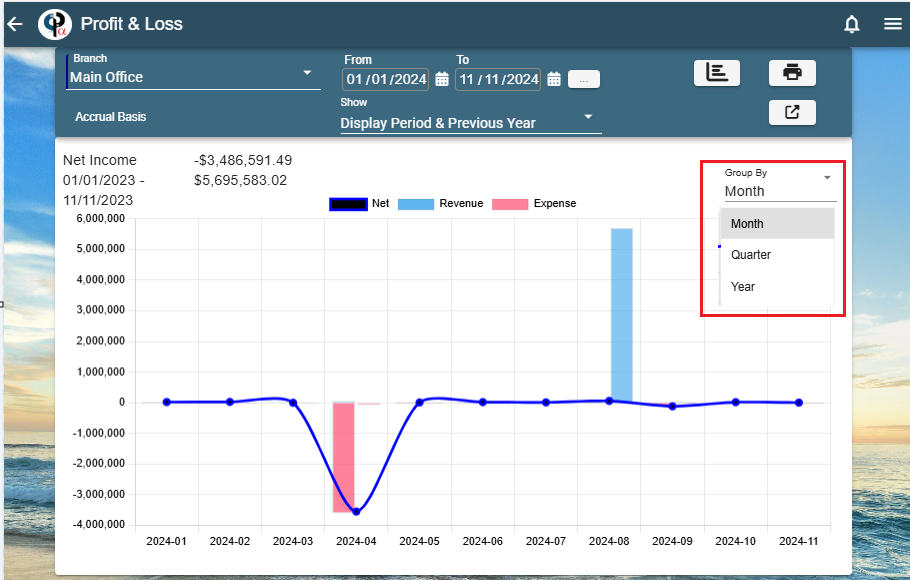
Choose what you want to group by, month, quarter or year.
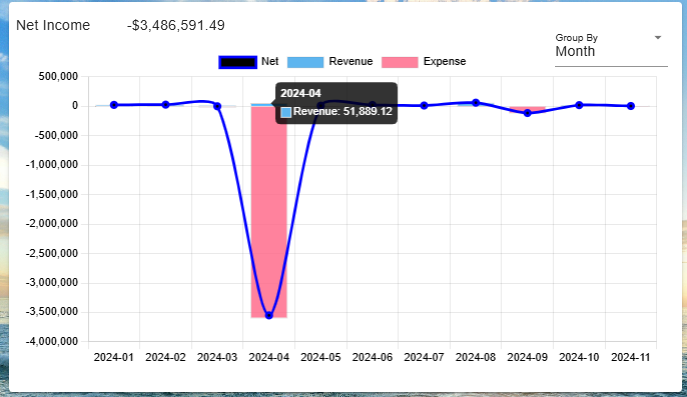
Hover on the graph to see some basic information
Click the graph to get detailed information
You can click the graph (any blue or pink) to see more details behind the graph.
Clicking on the bar graph will open the Journal Register for that category.
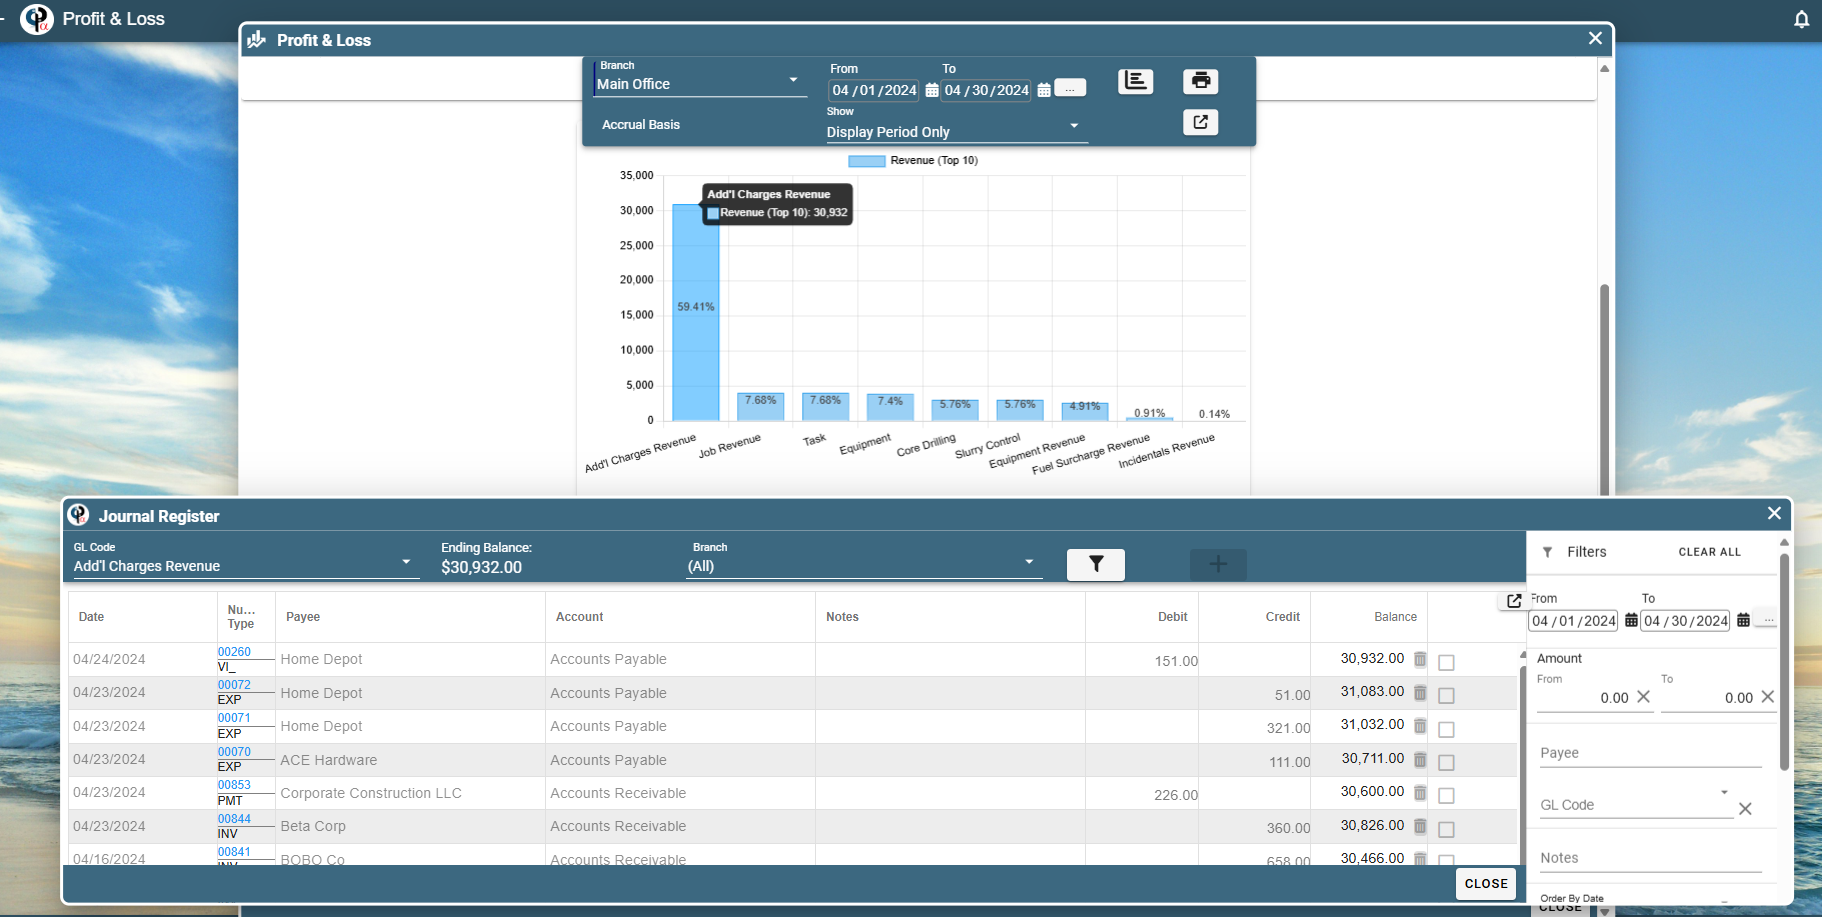
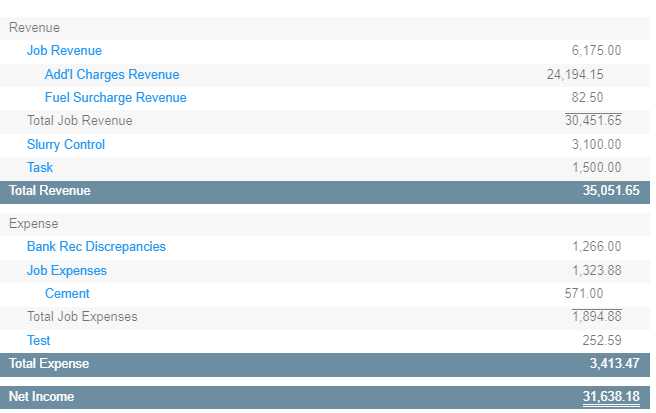
Click on a category to open the Journal Registry.
FAQ
Do entries that have not been reconciled show in the Profit and Loss report?
Yes