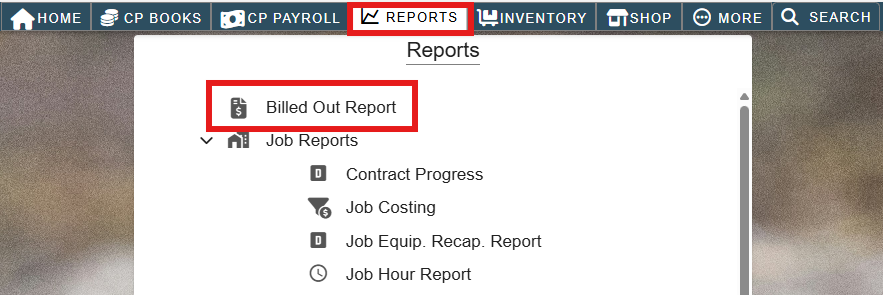
Run the billed-out report by going to Reports-> Billed Out Report
Billed Out Report is full of helpful options to narrow down the search parameters to get exactly what you are going after.
Start with a date range then select from the dropdown list Group By and Print your report.
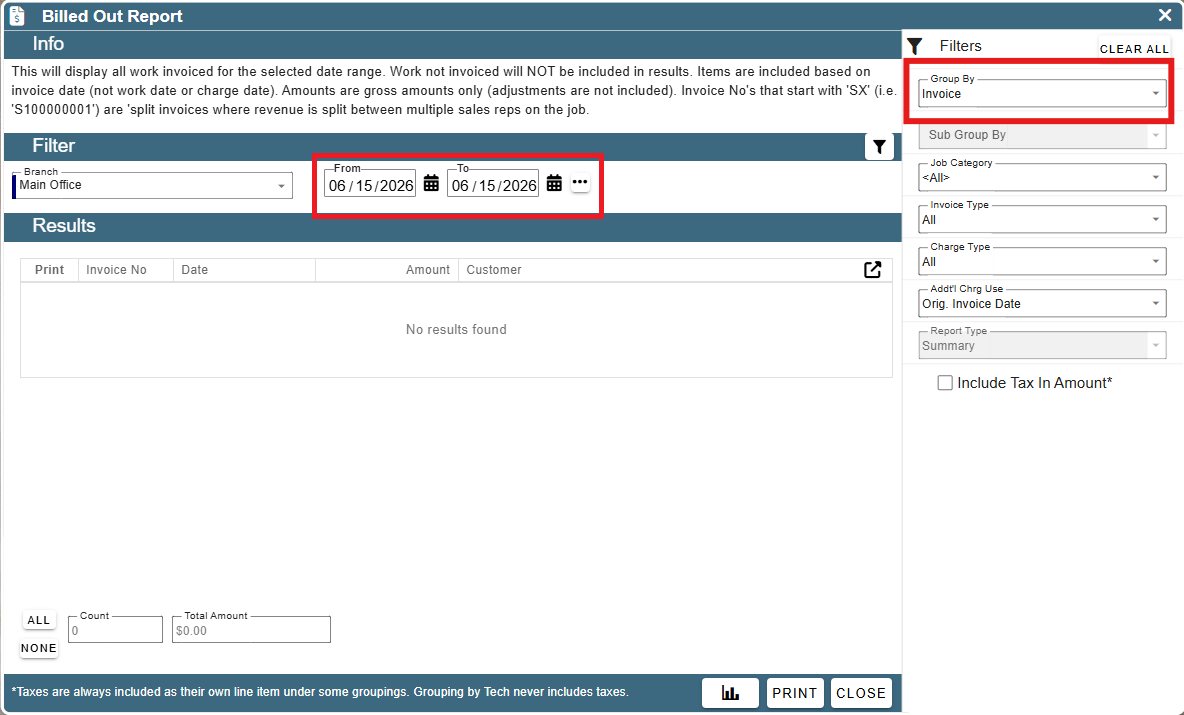
Grouping
Group by is SUPER helpful, so let's go over some of the useful things you can group by!
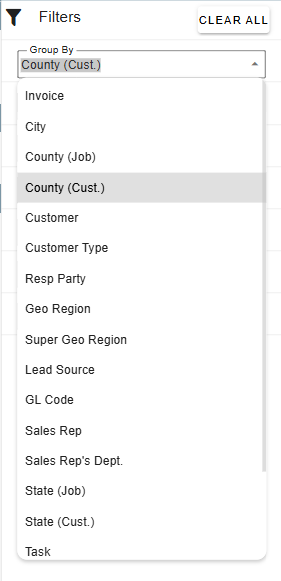
You can group the work and revenue by:
Invoice- see how much you have invoiced in a certain amount of time
* City- See how much a single city brought your company in
* County (Job)- See how much a county where jobs were set in made
* County (Cust)- See how much a county where a customer is located from made
* Customer- See how much a customer has brought you in during a certain date range
* Customer Type- See what kinds of customers are bringing you how much revenue
Resp Party- See how much a Resp Party brought you in
* Geo Region- See how much a certain geo region brought in
* Super Geo Region- See how much a super geo region brought in
* Lead Source- See where your customers are coming in from and how much each lead brought in
GL Code- See what each GL code is bringing in, revenue wise
* Sales Rep- See how much your sales reps are bringing in
* Sales Rep Department- See what department is bringing in the most money or FTs
* State (Job)- See what states are bringing in how much. Based on the job state
* State (Job)- See what states are bringing in how much. Based on the customer state
* Task- See how much revenue you are bringing in based on the tasks
Task Categories- See how much revenue you are bringing in based on the task categories
* Tech- See how much the jobs cost that your techs were assigned to
* Vehicle- See how much your vehicles were used to bring in, revenue wise
The * means that this item is subgroupable so you can define your groupings by another layer. Group one and then group another. Sub grouping. :)
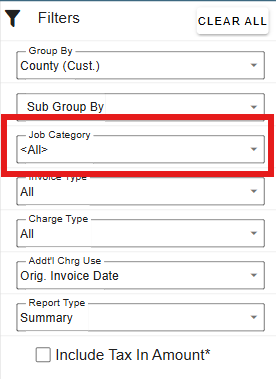
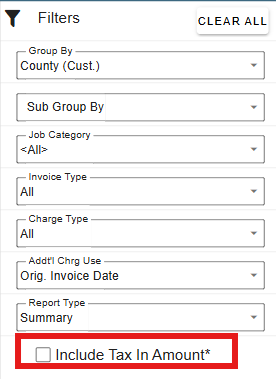
Job Category
This shows only the job category you select. To learn more about Job Categories: Job Categories
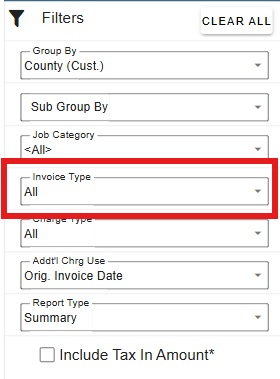
Invoice type
This will only show you jobs and revenue based on a certain Invoice Type, like Invoice and NSI
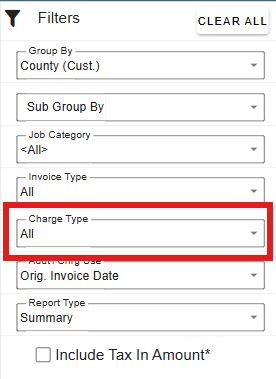
Charge Type
This will filter by the kind of charge the job had on it, like original charges only or additional charges only.
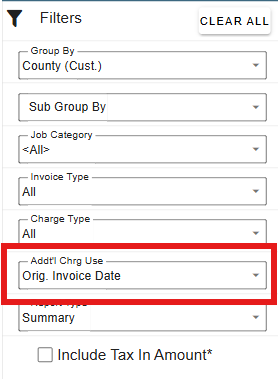
Addt'l Chrg Use
This will filter items by including either their original invoice date, or the date they were charged.
.png)
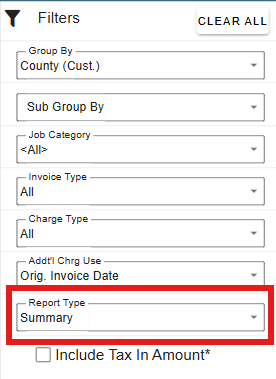
Report Type
This is how you want the report printed. If you choose detailed, you will see a breakdown listing each item and what's included with it. If you choose summary, you'll only get the overview of the items and what contributed to the revenue.
Include Tax
This will include the tax that factored into the revenue
Printing
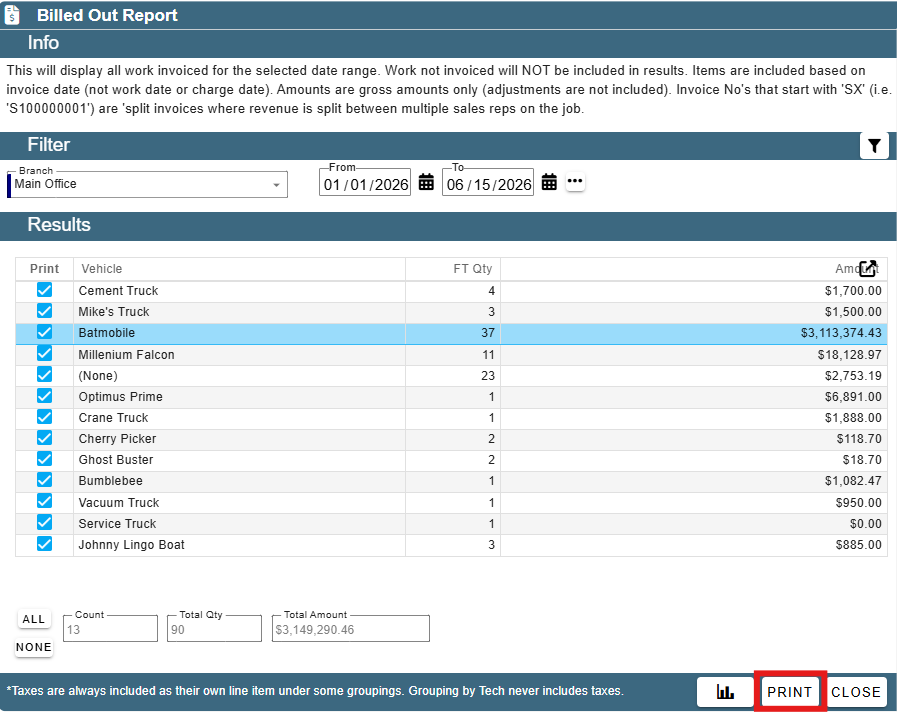
There's two ways to print this report. You can view it as a standard paper report, or as a graph.
Graphing
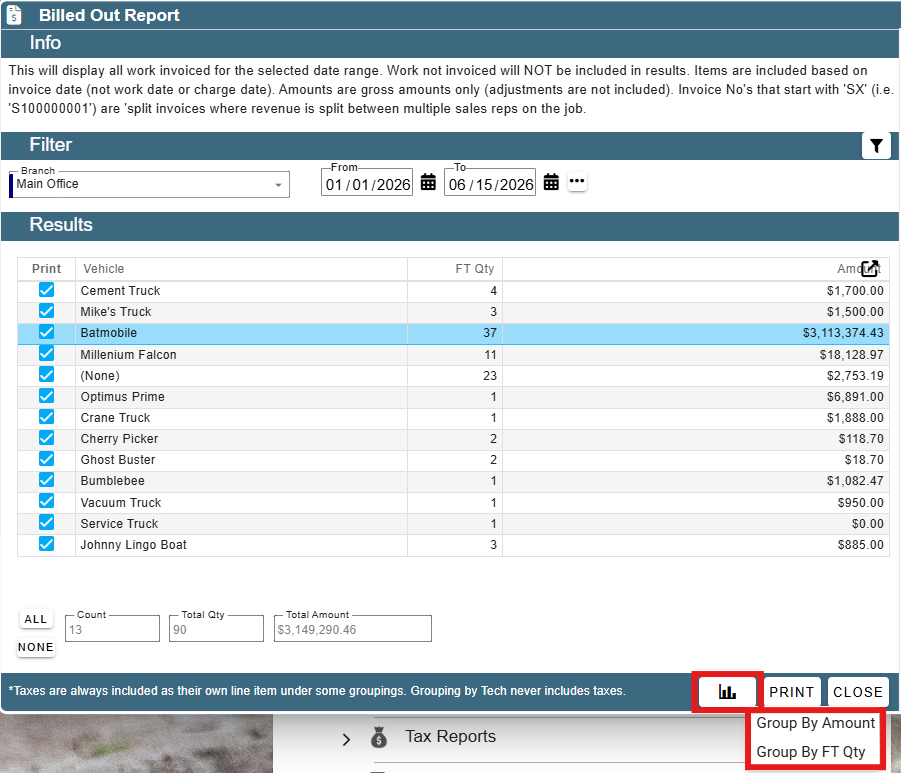
At the bottom of the Billed Out Report, click the little bar graph button. This gives you two options: Group By Amount and Group by FT Qty
Group by Amount- Allows you to see how much revenue each item gathered
Group by FT Qty- Allows you to see how many FTs each item had
This will print based on the Report Type you specify
FAQ:
Why is the Billed out report changing when invoice is paid by Credit Card?
There are two options within the Billed out report of how you want to handle additional charges.
1. Use the invoice date
2. Charge date
Select the appropriate one for your needs