
Dashboards are found on the main landing page. When you first start up using CenPoint, there won't be anything there. This doc is to help you fix it and learn about what each graph does.
Where to find the option to customize
On the main landing page, when you first load CenPoint up there will be a banner across the top that tells you that your dashboard is a little quiet. Next to that notification there's a button to customize it.
![]()
This gives you a screen that looks something like this:
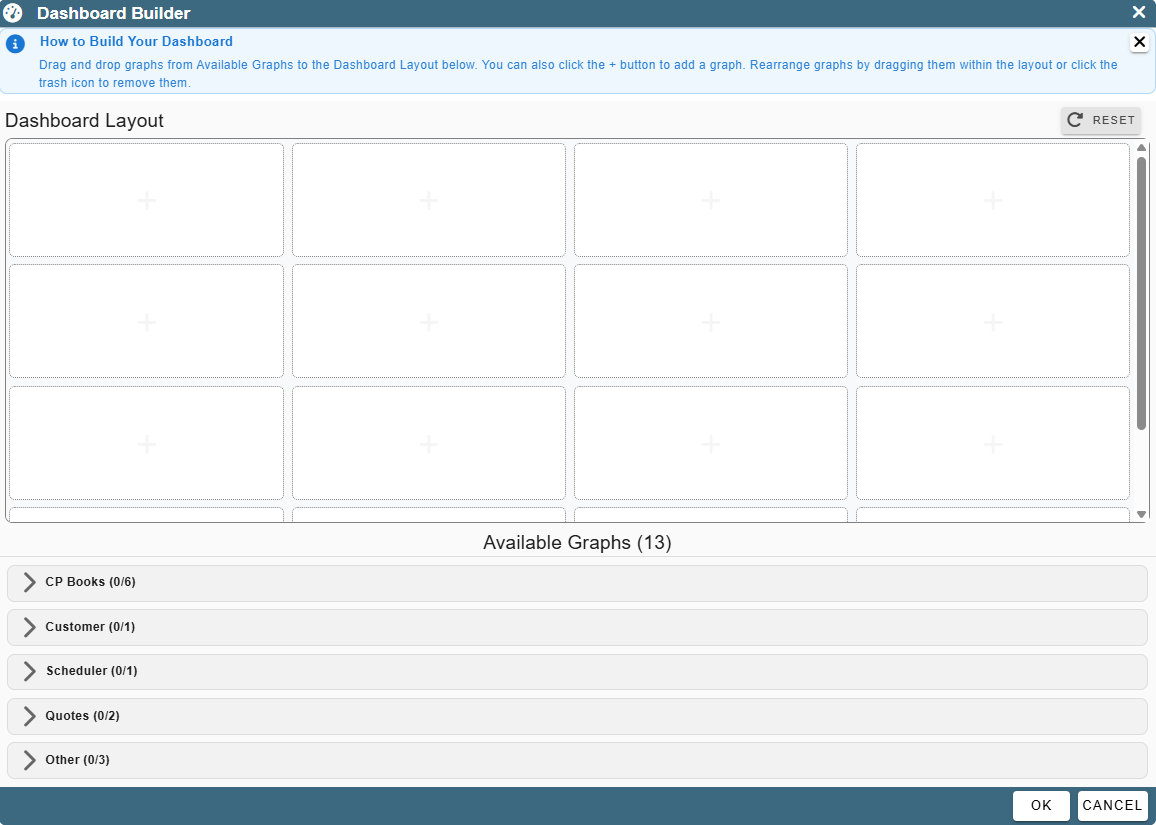
Overview of the graphs
CP Books
Aging (No Retention)
This shows the history of your aging with no retention.
.png)
The nodes are able to be clicked to pull up the A/R Aging Report screen. Let's click the 82,954 and see the screen that pops up.
.png)
Here we can see the grouping is for that 61-90 day's range and the total due is that same $82,954 amount.
A/P Coming Due
This is the A/P chart that shows how far out A/P is.
.png)
If we click one of these nodes, we open up the find bills page. Let's click the one above Past Due.
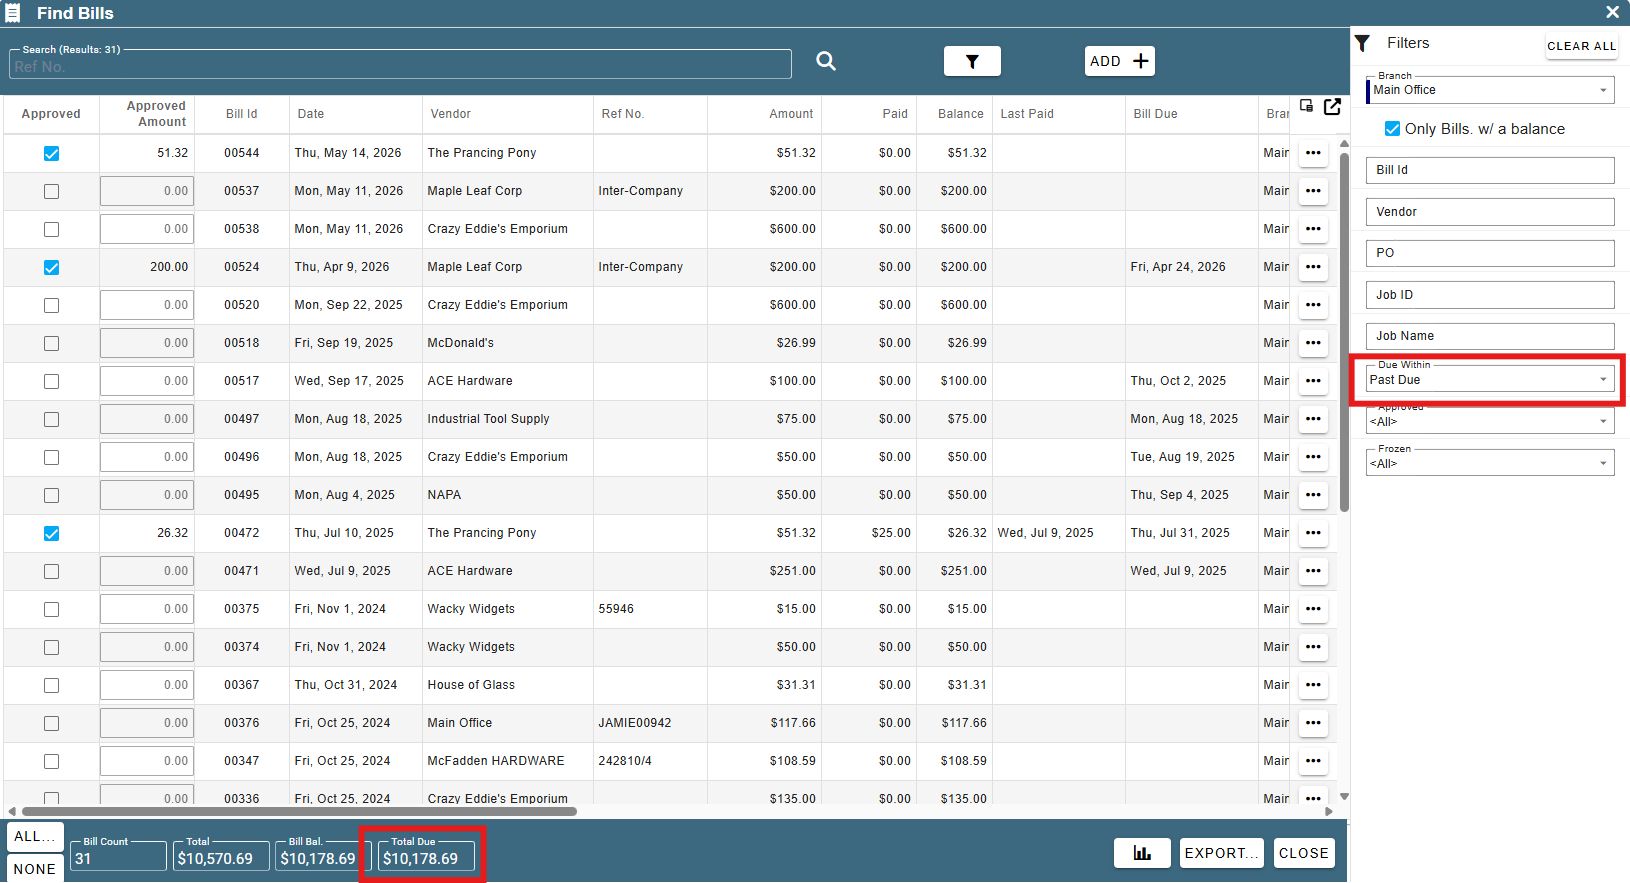
Here we can see that the filter is put to Due Within Past Due, and the total matches up with what we were seeing.
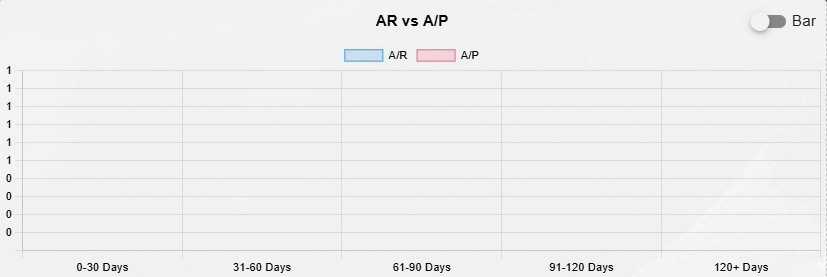
AR vs A/P
Amt Invoiced (Less Adj.)
This one shows how much you have invoiced with the adjustments included.
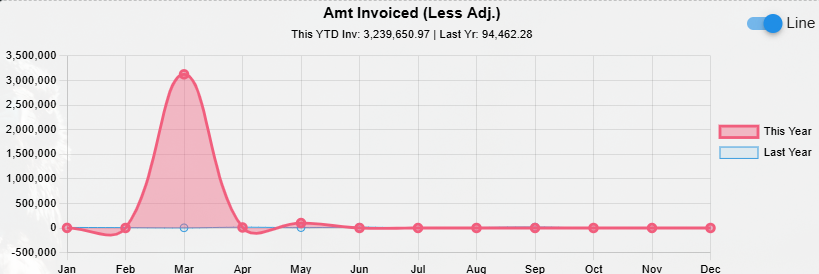
No clickable features as of yet.
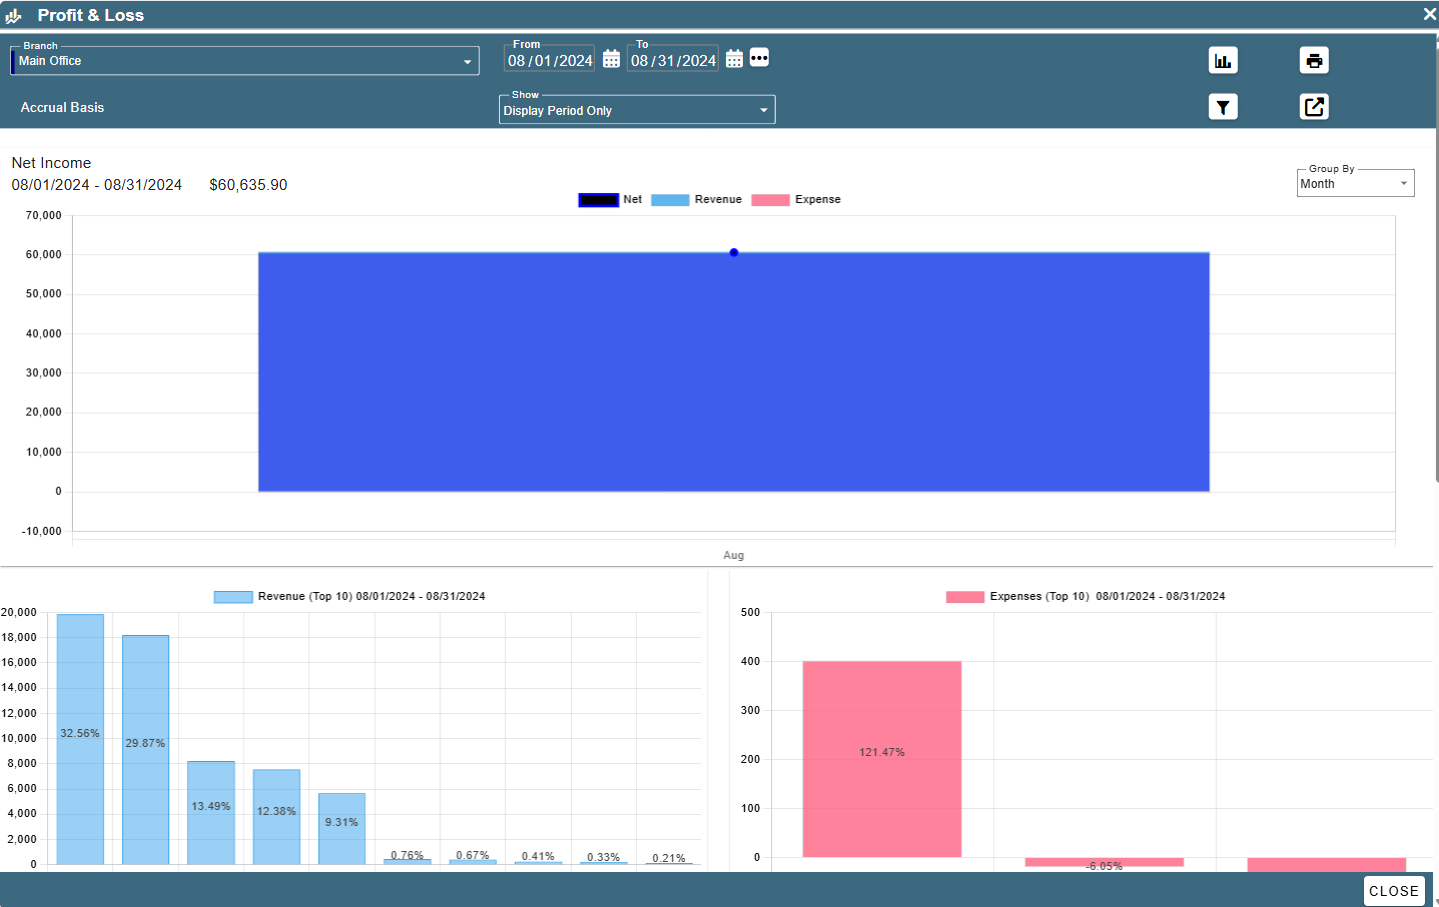
Profit & Loss
This shows your profit and losses for the months.
There's three graphs stacked here.
First is Net income, how much you have gained or lost over the time specified.
.png)
Clicking on one of these bars brings up the Profit & Loss screen for that specified time and will also show more of a breakdown of the Profit and Loss Statements.
This one also has hover ability, showing how much each bar represents.
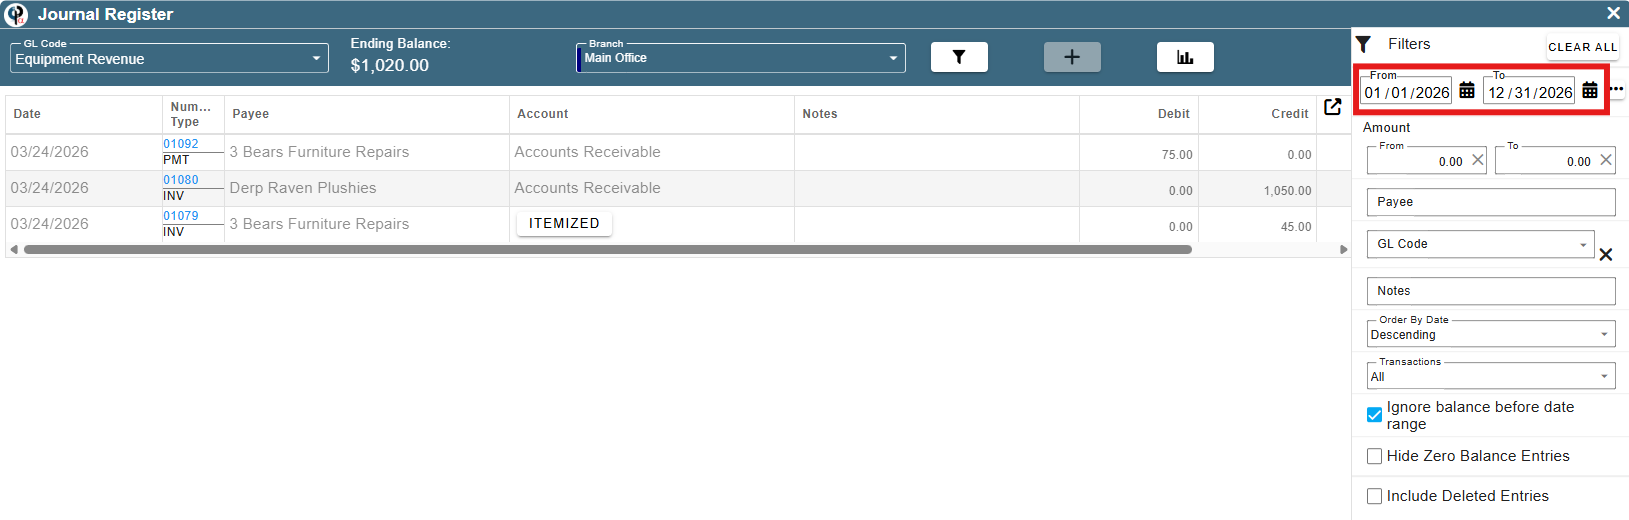
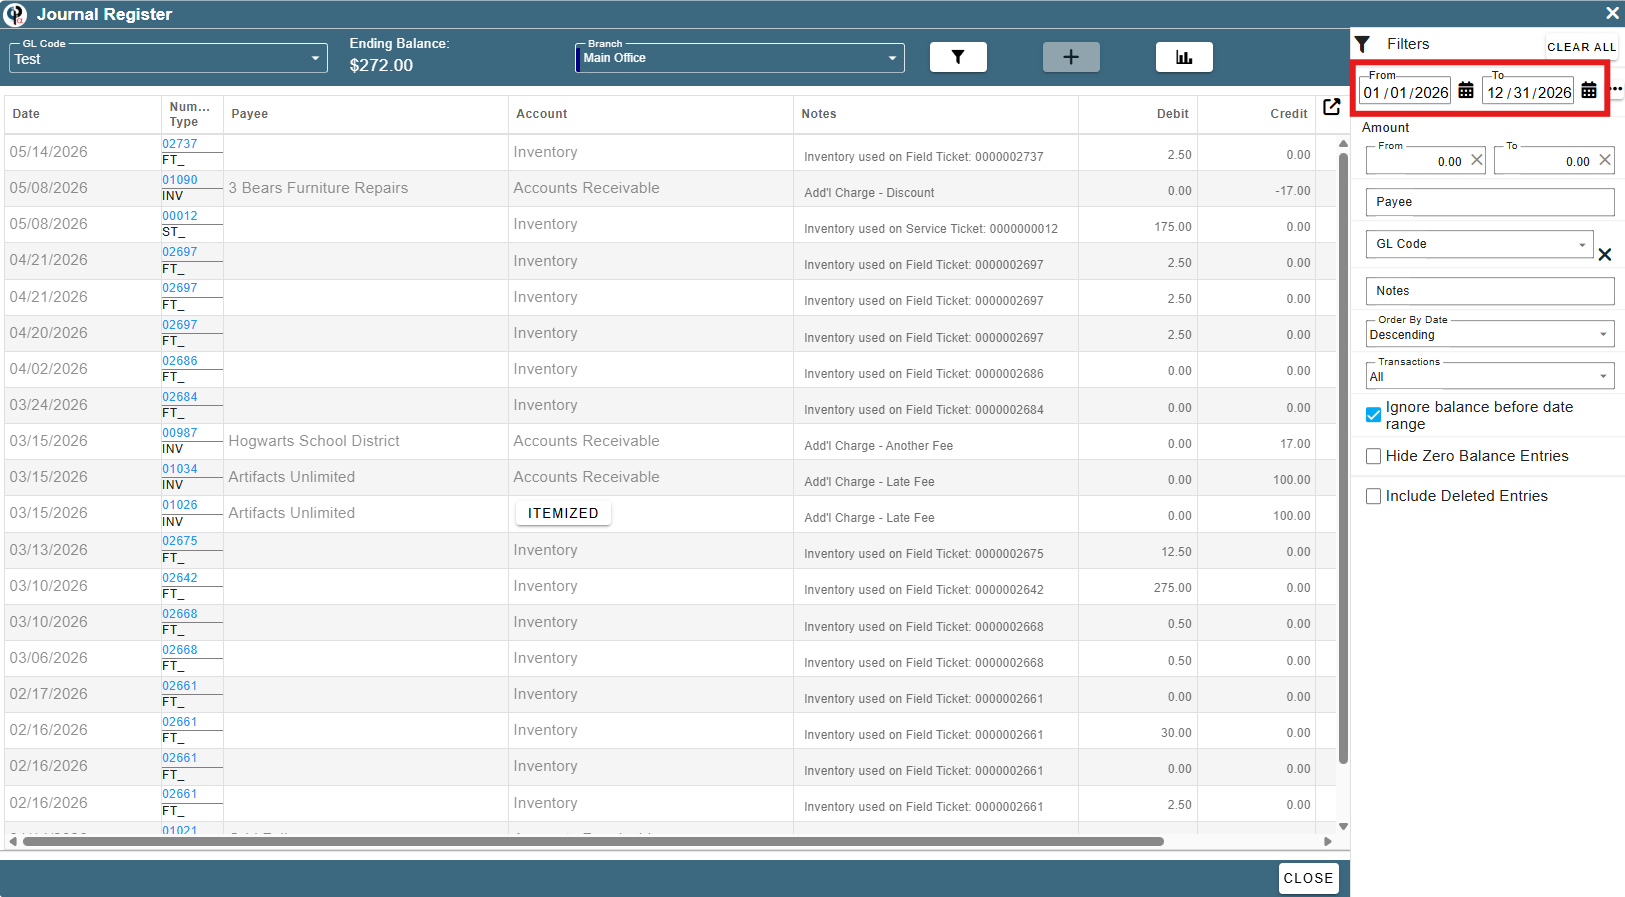
This next one shows your revenue from different category.
.png)
Clicking on one of these brings up the Journal Register where you can see the items contributing to the category.
This one also has hover ability to show more details
Last is the Expense Report. This shows how your expenses are laid out for the specified date range.
.png)
Clicking on one of the categories brings up the Journal Register where you can see the items contributing to the category.
This one also has hover ability to show more details.
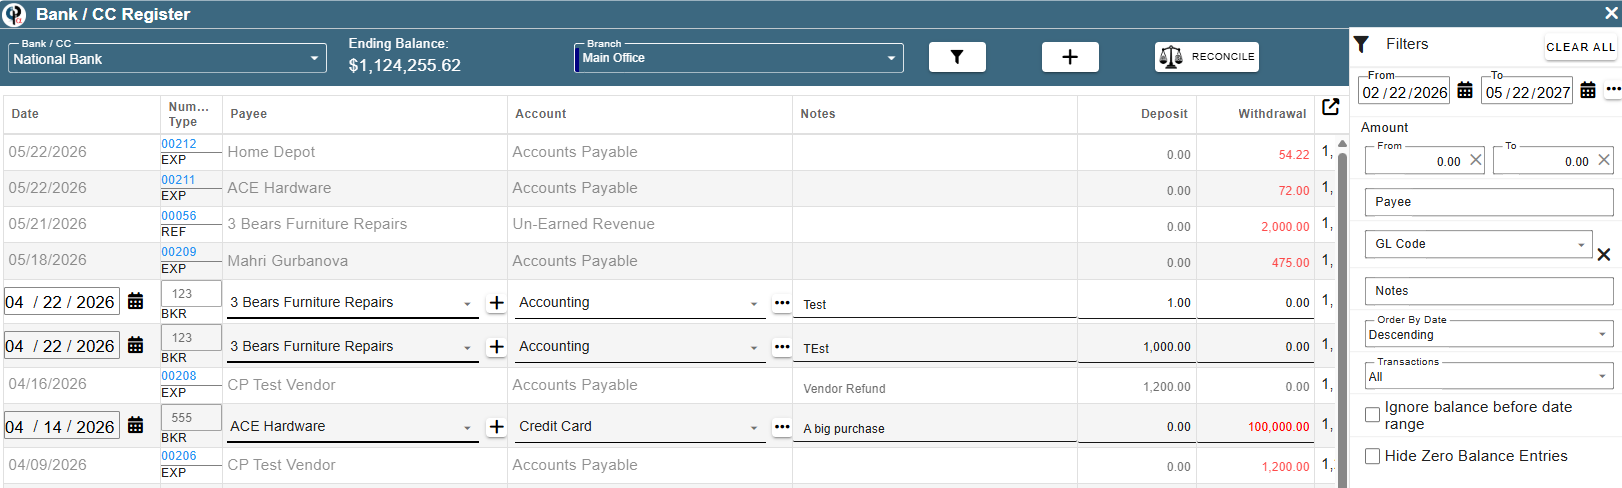
Bank/CC Current Balance
This shows integrations that you have with Banks or Credit Cards for the system.
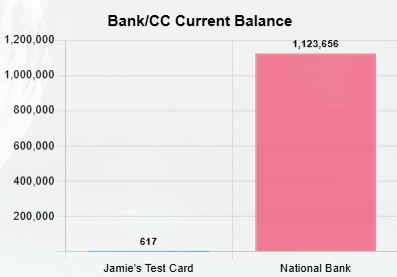
Clicking this shows the Bank / CC register page where you can manage what is there.
This also has hover ability to see more details
Customer
Top Cust (This Year)
This graph shows who the top earning customer is for the year.
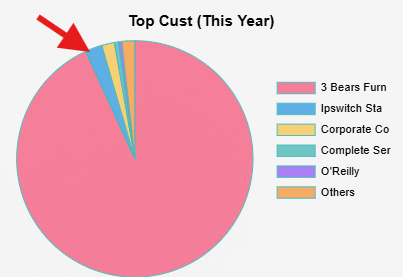
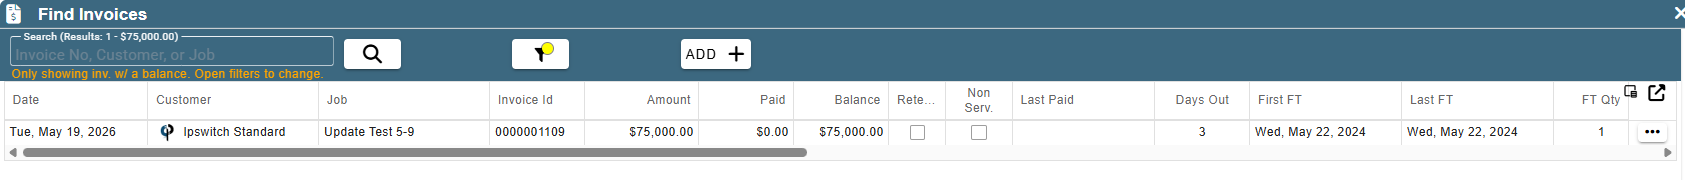
Clicking one of the pie sections we are taken to the invoices for the year and we see the customer in question.
This one has hover ability to show more details.
Scheduler
WO Stats
This one shows through the CenPoint workflow how much is being scheduled out and what is being done.
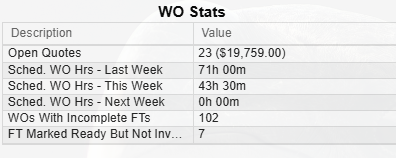
No click ability for this one other than sorting the two columns.
Quotes
Quoting Stats
This shows some stats on quoting. It can be filtered by user and shows a number of important information items that you may want at a glance.
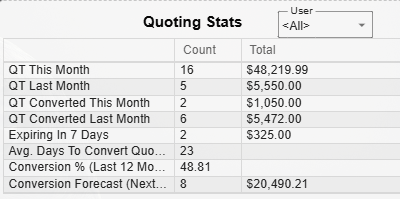
No click ability for this one other than sorting the three columns.
Quoted vs Converted
This shows the amount for the quotes for a particular month and also how much was converted.
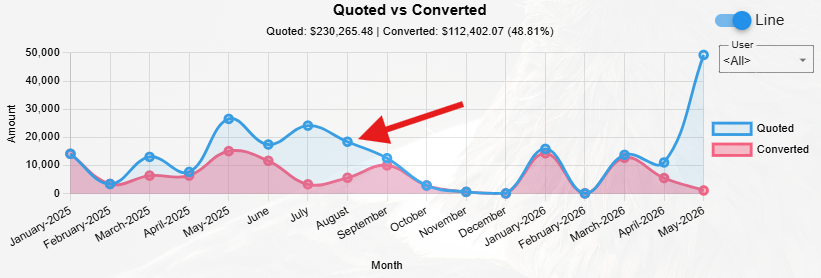
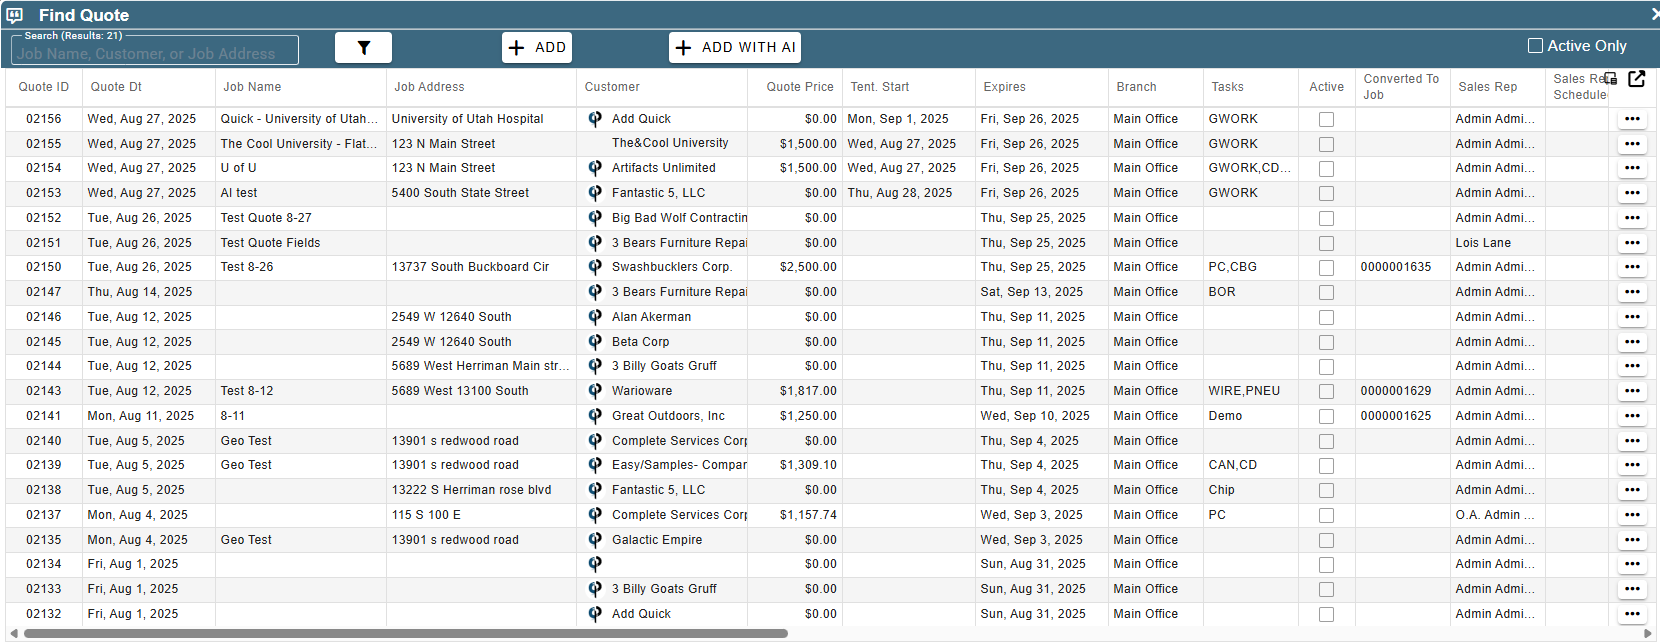
Clicking on the Blue, or Quoted, node for a month brings up all of the quotes for that particular month.
The Red, or Converted, node for a month brings up all the quotes that were converted for that particular month.
This one has hover ability to show more details.
Other
Top Sales Reps
This one shows how much your top sales reps have had invoiced successfully for this and last week.
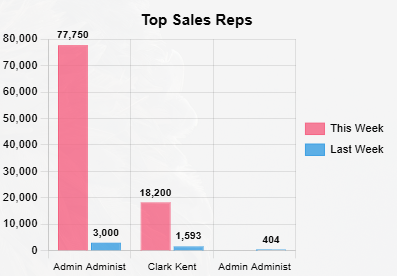
Clicking on one of these bars will bring up the Invoices screen set to filter to the sales rep and specified date range.
This one has hover ability to show more details.
Expiring
This shows you all of the licenses and certifications that are expiring soon or have expired already. This lets you stay up to date with your tech's certifications.
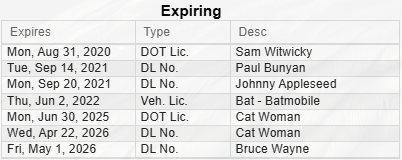
No click ability for this one other than sorting the three columns.
Upcoming Events
This shows you the upcoming events for your users, like birthdays and work anniversaries.
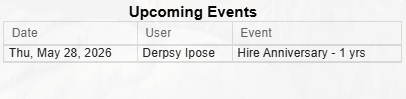
No click ability for this one other than sorting the three columns.